Faculty Mentor:
Ms. Chetna Laroiya
Student Name:
Lakshita Aggarwal (MCA-I)
ABSTRACT
In recent years, the size of data is growing exponentially by various means such as mobile devices, aerial sensory technologies, remote sensing, radio frequency identification readers etc. This data is stored after spending much cost whereas later it is ignored or deleted because there is not enough space to store it. Even if we succeed to store data it will contribute nothing until analyzed to get some new insights. Therefore, the first challenge for big data is storage mediums and second is capable software to analyze this data.
1. INTRODUCTION
In digital world, data is growing at an immense scale from digital sources which leads to the growth of the big data. Big data is a large collection of data. Big data are the data sets that are so big and complex that traditional data processing application/software cannot deal or process them. It includes those datasets with extremely large sizes which are beyond the ability that commonly used software tools can process them. Big data analytics face challenges such as capturing data, data storage, data analysis, search, share, transfer, visualization, querying, updating, security etc. Big data generally includes the semi-structured or unstructured data i.e. the information that does not have a predefines data model and is also not organized in a structured manner. It is text heavy and difficult to decode the useful information from it. The size of big data is constantly increasing. It is ranging from a few dozen terabytes to many Exabyte’s of data. Big data requires a set of techniques and technologies with new forms that could execute diverse data sets, complexity and at a massive scale.
2. CHARACTERISTICS OF BIG DATA:-
Big data is characterized having 3Vs to 4VS. The 3Vs were Volume, Variety, and Velocity. Later, as the digital growth increased at a pace the 4V was also included i.e. Veracity.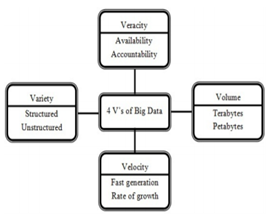
Fig 1: Four Dimensions of Big Data
1. Volume – It is the size of data that decides whether the data is big or not. The data is even in terabytes or petabytes. Massive data needs to be analyzed to extract useful information.
2. Variety – It is the type and nature of data i.e. text, image, audio or video. It also determines whether the data is structured, semi-structured or unstructured.
3. Velocity – It is the speed at which the data is generated and processed to fulfill the demands of the industry. The data is growing equivalent to the growth of the digital world. The rate of growth of the data is directly proportional to the growth of the digitalization.
4. Veracity – It is the quality and accuracy of the data captured. It also includes the availability and accountability of the data.
3. LEVELS OF BIG DATA TOOLS:-
Big data tools are divided into levels on the basis of sophistication and market strategy:-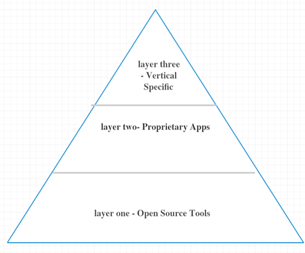
Fig 2: Three levels of Big Data Tools
Layer one – It is the largest and wide areas for “open source tools”. This includes basic infrastructure, servers, and storage. Mostly cloud players use this layer.
Layer two – In this layer, vendors realize to increase the market share by building proprietary apps. At this layer, Hadoop is mainly used.
Layer three – These are vertical specific apps. It is a very effective big data tool. It also integrates with PWC, Accenture.
After studying these levels we categorize the big data tools into two categories:-
1. Open source tools – Open source tools are those tools whose source code is made available for use or modifications. It is freely available to use for people. The software distributed can be used by anyone or modified by anyone without restrictions. Some of the open source big data tools are HPCC (High –Performance Computing Cluster), Hadoop, Apache SAMOA, Apache Cassandra, Elasticsearch, MongoDB, Storm.
2. Proprietary tools – Proprietary tools are those tools which are the property of an individual no other can access it. Only the owner is liable to make changes in these tools. Some of the proprietary big data tools are Pentaho Business Analytics, Skytree Server, Splunk, Jaspersoft.
Big data tools:- The amount of data collected from various applications all over the world across a wide variety of fields today is expected to double every two years. It has no utility unless these are analyzed to get useful information. This necessitates the development of techniques which can be used to facilitate big data analysis by using the following big data tools. A large number of tools whether open source or proprietary are available to process big data.
3.1 Apache Cassandra
Apache Cassandra is a free and open source distributed tool. This tool is used as it provides an effective management of large data. It offers high availability and scalability. The Cassandra offers advantages in fault tolerance, performance, decentralization, professional support, durability, elasticity, and scalability. It is a high-speed transactional data. It is a “NoSQL“ database. The architecture of Cassandra is to handle big data workloads across multiple nodes without any single point of failure. It has a peer-to-peer distributed system across its nodes, and data is distributed among all the nodes in a cluster. In spite of all such uses of Cassandra, it is highly useful in sites such as eBay, Netflix.
3.2. Hadoop
Hadoop is another popular tool used for storing a large volume of data.It is yet another product from Apache used by many large corporations for the big data. Hadoop was developed in 2006 by computer scientists Doug Cutting and Mike Cafarella. It is an open source big data tool. It is a Java-based programming framework that enables the processing and storage of extremely large datasets. Hadoop is an advanced software library which contains a superior library for a large volume of data sets. It has great processing capabilities and developers of Hadoop regularly update and improve the product. Hadoop is helpful in fault tolerant storage and high throughput data processing. Hadoop is used for batch processing. It uses map-reduce jobs for corresponding applications. Hadoop architecture consists of the Hadoop kernel, map reduces, Hadoop distributed file system (HDFS) and apache hives. Map reduce is a programming model for programming large dataset, based on the technique of divide and conquer method.
In Hadoop, we divide the data and then conquer method is implemented in two steps such as map step and reduce step. It works on two different kinds of nodes such as a master node and work node. The master node divides the data inputs into smaller subproblems and then distribute them further to work nodes in map step. After all master node combines outputs of sub-problems by reducing step. Map step and reduce step works together for solving the analytics of big data processing.
3.3 Plotly
Plotly is a leading open source software used by web-based data and analytics apps. It is a big tool to create dynamic visualization if the company does not have the time or skills for meeting the needs. It makes information graphics easy by using online tools. It allows data scientists to share interactive graphs and apps with the rest of the world. Plotly is a tool for creating sharp and slick chart starting from a simple spreadsheet. Various important companies use Plotly, for example, Google and also the U.S. Air Force, Goji, and The New York University.
3.4 Mongo DB
MongoDB is an opensource and free software. It is released under a combination of the GNU Affero General Public License and the Apache License. It is a schema-less document-oriented database. It is useful for working on data sets that vary or change frequently with the semi-structured or unstructured data. It is flexible enough to fit in almost any use cases. The uses of Mongo DB includes storage of data from mobile apps, content management system, products the catalogs and many more. It includes queries on the database. The architecture of Mongo DB includes a single database is split into a number of databases, then a database is split into a number of collections and then the collection is further split into a number of documents and documents into Key – value pairs.
3.5 Drill
The drill is an open source and distributed framework that allows working on the interactive analysis of large-scale datasets. The drill is developed by Apache to serve and process petabytes of data in seconds and millions of records. It supports tons of file system in Google cloud storage, AmazonS3, and many more. It supports many types of query languages, data formats, and data sources. It is specially designed for dividing the application in nested data form. It has the capability to process petabytes of data and trillions of records in seconds. Drill use HDFS (Hadoop distributed file system) for storage and map reduce to perform batch analysis of the big data.
5. STORM
The storm is an open source and distributed big data tool. It is specially designed for real-time processing of unstructured data. It is easy to set up, reliable, fault proof and provide competitive performance. The storm cluster is similar to the Hadoop cluster. Storm cluster uses different topologies for different storm tasks. It is capable enough to become compatible with any programming language. The storm is an open source real-time distributed computing framework. Now, even twitter uses storm. A topology processes messages all the time until the user terminates it. A storm cluster consists of two kinds of nodes such as a master node and worker node. The master node works as Nimbus and worker node as a supervisor. The Nimbus and supervisor perform similar functions job tracker and task tracker of a map-reduce framework like Hadoop. Nimbus is responsible for distributing code across the storm cluster, scheduling and assigning tasks to worker nodes, and monitoring the whole system. The supervisor node complies with all the tasks as assigned to them by Nimbus. Storm starts and terminates the process as instructed by Nimbus. The whole process is distributed into a number of worker processes and each process implemented as a part of the topology.
6. SPLUNK
Splunk is one of the proprietary tools. Splunk is a real-time platform for exploiting machine-generated big data. Splunk combines the cloud technology and big data. It helps users to search, monitor and analyze their machine-generated data through web interfaces. The results are shown in an intuitive way such as graphs, reports, and alerts.
Splunk is different from other tools in terms of indexing structured, unstructured machine
generated data. It can perform real-time searching, reporting analytical results, and dashboards.
The most important objective of Splunk is to provide metrics for many application, diagnose
problems for system and information technology infrastructures, and intelligent support for
business operations.
Big Data Applications:-
1. Government
2. Social Media Analytics
3. Technology
4. Science And Research
5. Fraud detection
6. IT log analytics
7. Call Centre Analytics
7. REFERENCES:-
1. https://www.google.co.in/search?q=unstructured+data+in+big+data&rlz=1C1
EKKP_enIN800IN800&oq=unstructured+data
+in+big+data&aqs=chrome..69i57.7677j0j7
&sourceid=chrome&ie=UTF-8
2. https://en.wikipedia.org/wiki/Unstructured_data
3. https://www.datamation.com/big-data/top-12-big-data-tools.html
4. http://thesai.org/Downloads/Volume7No2/Paper_
67A_Survey_on_Big_Data_Analytics_Challenges.pdf
5. https://pdfs.semanticscholar.org/34d3/15791e
7566eab7e9d4ef4c60762f7b0989b7.pdf
6. https://www.google.co.in/search?q=cassandra+
in+big+data&rlz=1C1EKKP_enIN800IN800&oq
=cassandra+in+big+data&aqs=chrome..69i57j0l5.
6314j1j8&sourceid=chrome&ie=UTF-8